
Trailblazer PRO is a collection of additional tools for working with Trailblazer, such as the following.
#wtf.trailblazer-workflow process engine.
It is free of charge for low-volume users. Please consider purchasing a subscription in order to support Trailblazer development.
Using our web debugger in your project is as easy as the following five steps.
In your Rails’ Gemfile, add the gem.
gem "trailblazer-pro-rails"
In your Rails app, run our generator and enter your API key.
$ rails g trailblazer:pro:install
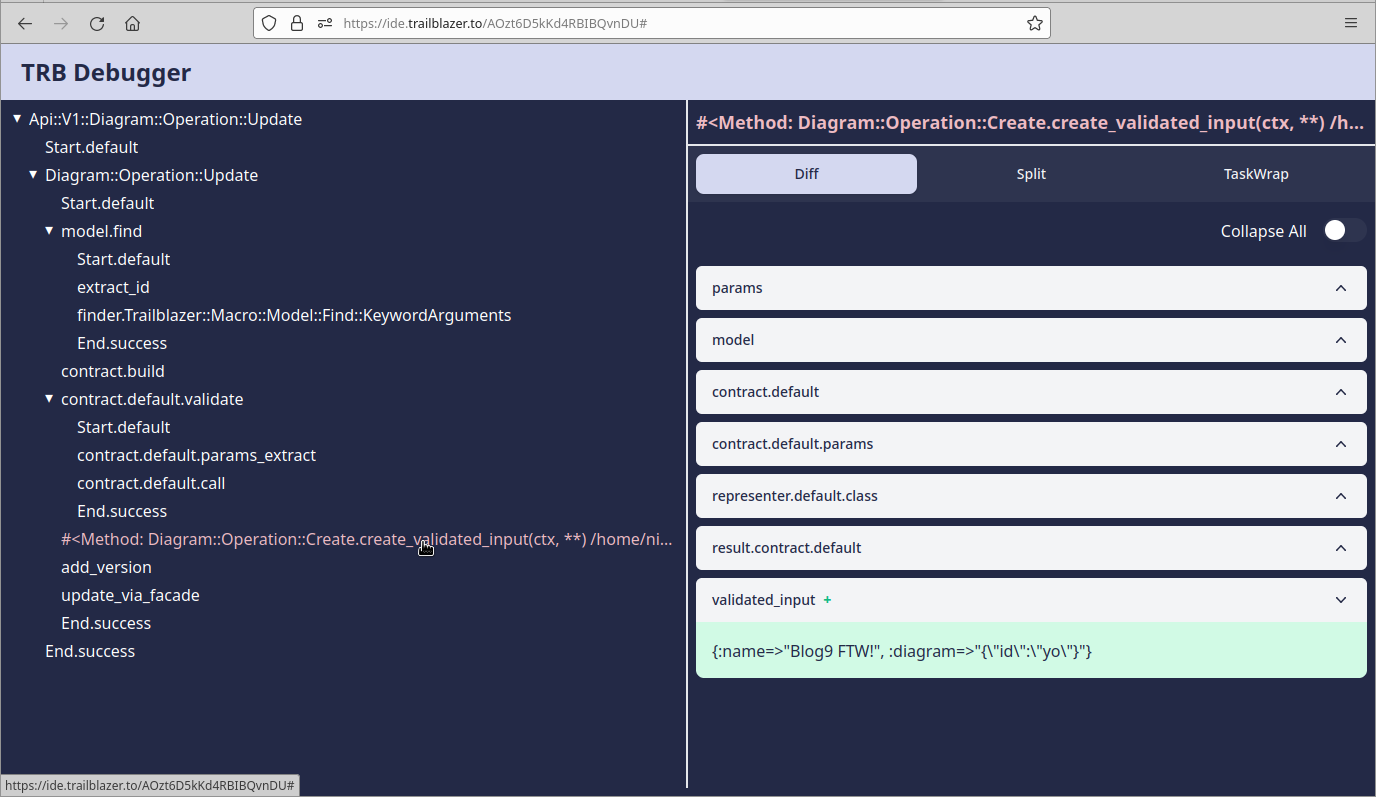
You’re now ready to trace and debug on the web.
Run your operation via #WTF?.
result = API::V1::Diagram::Operation::Update.wtf?(params: params)
Click the [TRB PRO] link in your terminal and start debugging.
You can use the new method Operation.WTF? to explicitly trace using the web debugger.
result = API::V1::Diagram::Operation::Update.wtf?(params: params)This will always send the trace to the web, regardless of any configuration.
It’s possible to web-trace operation that’re invoked with the generic Operation.().
For example, you could automatically web-trace specific operation run from a controller with the following configuration in config/environments/development.rb.
  config.trailblazer.pro.trace_operations = {
    "API::V1::Diagram::Operation::Update" => true,
  }
The trace_operations directive allows you to enable web-tracing for particular operations.
If needed, you can enable it for all operations.
# TODO
Please note that trailblazer-pro and trailblazer-pro-rails are still experimental, and we’re presently collecting “power user” experiences and feature requests.
Planned features are